


Business analytics fails when it delivers insights without action, lacking clear decisions, ownership and integration into real business workflows.
We were running what should have been a routine analysis.
A share-of-business review for logistics vendors. Standard exercise. Clean dataset. Well-structured reporting. The kind of analytics most organizations are proud of.
One vendor was handling more than 70% of the total logistics volume.
At first glance, nothing looked wrong.
Large vendor. Good capacity. Established onboarding. No obvious compliance breach. The numbers were accurate, the visuals were polished and the conclusion seemed straightforward: this vendor was simply the dominant player in the network.
Technically, the analytics was flawless.
Practically, it was useless. Because it answered the surface question, not the structural one.
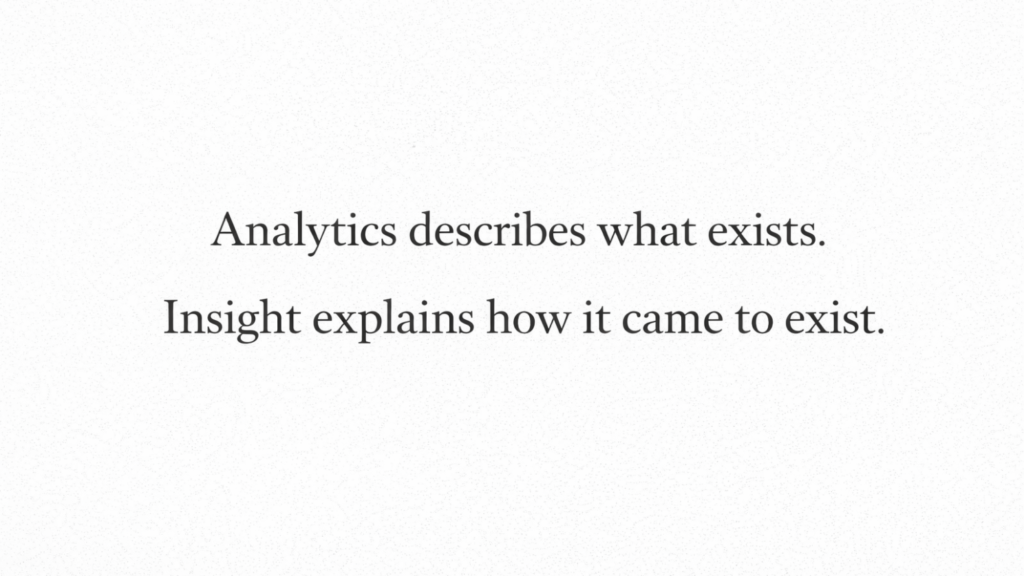
And most business analytics fails in exactly this way. It describes what exists but does not interrogate how it came to exist.
That distinction is where insight lives.
The Column That Changed the Story
We asked a simple follow-up question: “When was this vendor onboarded?”
And added a single column to the dataset: onboarding date.
That one addition transformed a stable-looking distribution into a timeline. And timelines behave very differently from static reports. They introduce causality, sequence and inflection points.
Before the onboarding date, business was distributed relatively evenly across vendors.
After the onboarding date, more than 70% of the total business shifted abruptly to the new vendor.
Not gradually. Not through organic growth. Not through performance-driven migration.
The shift was sudden.
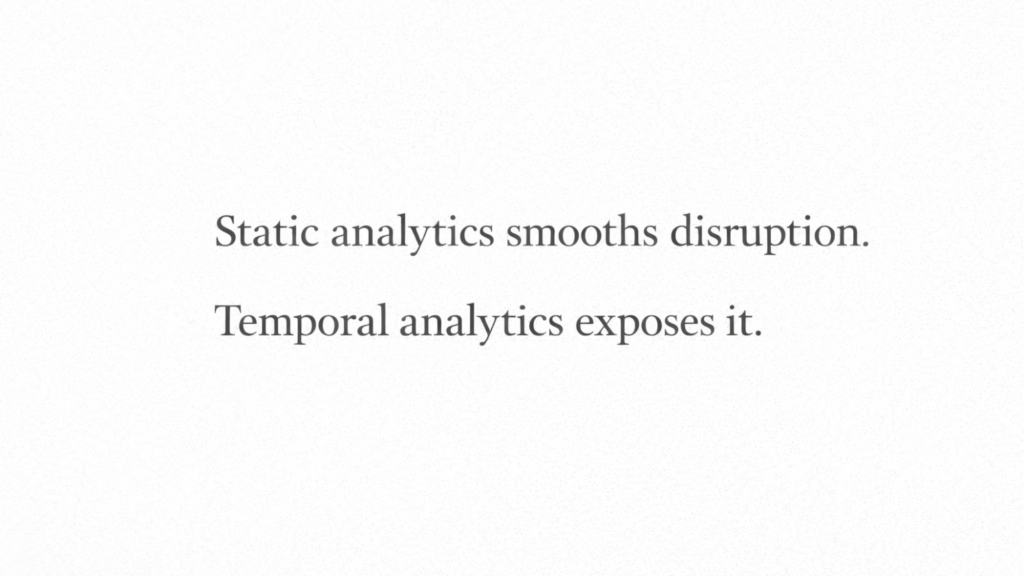
When analytics is static, abrupt change hides inside averages. When analytics becomes temporal, abrupt change becomes visible.
And abrupt change demands explanation.
The dataset had not changed. The math had not changed. Only the context had changed.
That is the moment analytics moves from reporting to investigation.
The Second Dot
We extended the timeline.
We introduced another operational variable: the recruitment date of the logistics manager.
The proximity between the manager’s hiring and the vendor onboarding date was striking. Close enough to trigger suspicion. Close enough to justify escalation.
At this point, the analytics was no longer a descriptive artifact. It was a hypothesis generator.
Nothing in the raw numbers violated policy. Nothing in isolation proved misconduct. But the pattern was statistically improbable. And improbability in operational systems is a signal. Mature analytics does not stop at improbability; it treats improbability as a prompt to ask better questions.
The insight led to a structured review of the supply chain process:
- vendor onboarding controls
- allocation logic
- approval workflows
- authority segregation
- conflict-of-interest safeguards
The investigation ultimately uncovered preferential allocation patterns and kickback exposure. What began as a routine “share of business” analysis resulted in a supply chain governance redesign.
New onboarding standards were implemented. Allocation transparency increased. Audit trails were embedded in workflows. Decision authority was separated. Controls were hardened.
The organization did not improve a report. It improved a system.
And that is the difference between analytics that informs and analytics that transforms.
The Structural Failure of Most Analytics
The original report was not wrong. That is what makes this case instructive.
Most analytics that fails in practice is technically correct. It is accurate, complete, clean, statistically defensible and strategically hollow. They are optimized for measurement precision instead of interpretive depth.
Traditional analytics is snapshot-driven. It captures states: current performance, present distribution, latest totals.
But business risk, operational manipulation and governance weaknesses rarely live in states.
- They live in transitions.
- They live in what changed.
- They live in when it changed.
- They live in who was present when it changed.
Static analytics is comfortable. It gives leaders a sense of control. It reduces complexity into digestible visuals. But it also smooths discontinuities. It hides inflection points inside aggregated stability.
Real insight often appears exactly where smooth curves break.
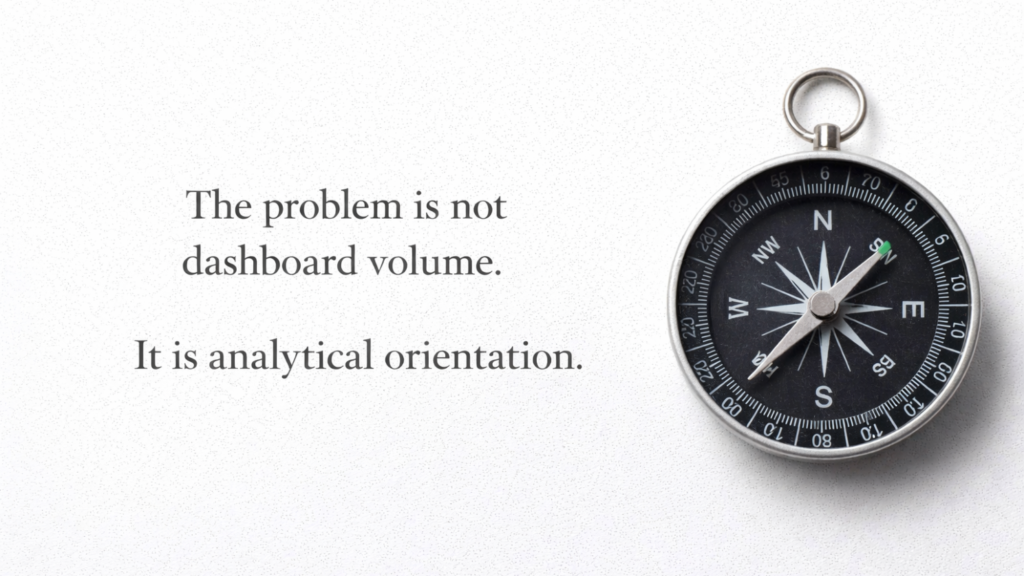
The mistake organizations make is assuming more dashboards will surface those breaks. In reality, the problem is not dashboard volume. It is analytical orientation.
Most teams analyze conditions. Very few analyze sequences.
And sequence is where causality hides.
Joining Dots Is a Discipline, Not an Accident
There was no advanced machine learning in this case. No predictive modeling. No artificial intelligence. No exotic tooling.
The breakthrough came from layering operational context onto quantitative output.
- Vendor onboarding timeline.
- Business allocation shift.
- Personnel movement.
- Temporal alignment.
Each element alone was benign. Together, they formed a narrative.
Analytics becomes powerful when it behaves like investigative reasoning rather than passive observation. That requires analysts to think less like report builders and more like system diagnosticians.
The question is not “What does the data show?”
The question is “What story does this pattern imply?”
And stories require context.
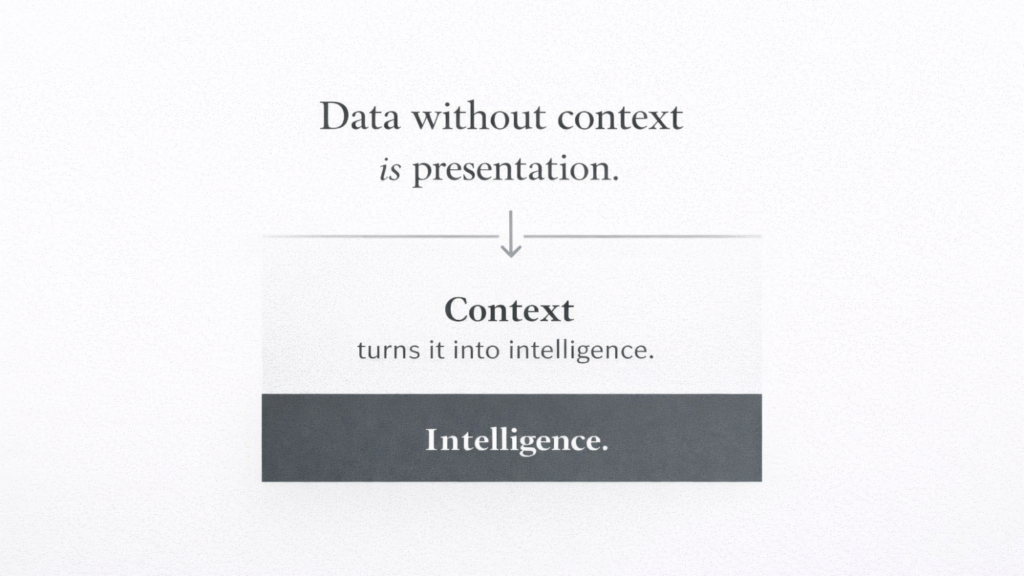
Context is what converts numbers into meaning.
Without context, analytics is decorative. With context, analytics becomes governance infrastructure.
That distinction is critical for leaders who believe analytics maturity is achieved through tooling investment alone. Tools amplify capability, but they do not create interpretive intelligence. That comes from analytical posture — the willingness to treat data as a starting point for inquiry rather than an endpoint.
Why Leaders Should Care
This case was not about vendor imbalance. It was about organizational blind spots.
The original analytics environment could detect distribution but not explain evolution. It could summarize the present but not interrogate the past. That limitation is common in mature enterprises that have invested heavily in reporting sophistication but lightly in investigative frameworks.
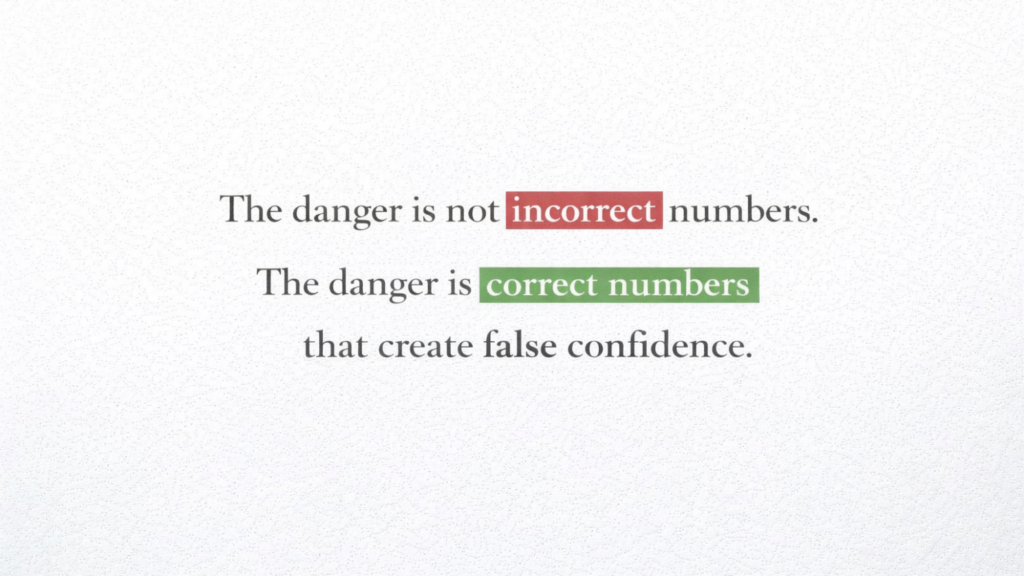
The danger is not incorrect numbers. The danger is correct numbers that create false confidence.
When leadership sees technically sound analytics, it assumes operational integrity. But analytics that does not interrogate transitions can coexist comfortably with structural weaknesses.
Useful analytics is not defined by how much it measures. It is defined by what it reveals about system behavior under change.
Executives operate in environments shaped by transitions: new hires, vendor onboarding, pricing shifts, regulatory adjustments, incentive redesign, leadership turnover. Each transition introduces new power dynamics and risk surfaces.
Analytics that ignores transitions ignores where governance stress accumulates.
And governance stress is where crises are born.
From Reporting to Investigative Analytics
Investigative analytics is a mindset shift.
Instead of asking “What is happening?”, it asks:
- What changed?
- What preceded the change?
- What followed the change?
- Who had agency at the moment of change?
- What system allowed the change to persist?
These questions transform analytics from descriptive reporting into structural examination.
The goal is not suspicion. The goal is visibility.
When organizations adopt investigative analytics, they do not become paranoid. They become resilient. They learn to see discontinuities early. They surface patterns before they metastasize into scandals or operational failure.
The supply chain revamp in our case was not triggered by an audit mandate. It was triggered by curiosity applied to data with context.
That is a repeatable discipline.
And it is available to any leadership team willing to demand more than surface accuracy.
The Practical Standard for Useful Analytics
If analytics does not help an organization understand how its systems evolve under human influence, it is incomplete.
Leaders should challenge their analytics teams to move beyond performance reporting and into transition mapping. Every critical metric should be paired with a timeline. Every operational shift should be examinable in sequence. Every anomaly should be treated as a prompt, not a footnote.
This does not require massive technology investment. It requires analytical intent.
The most powerful question in analytics is often the simplest one: “When did this start?”
That question forces history into the frame. And history exposes patterns that snapshots conceal.
Closing Thought
Technically correct analytics describes the surface of a business.
Practically useful analytics explains its motion.
Organizations rarely fail because they lack data. They fail because they misinterpret stability, overlook transitions and trust static pictures of dynamic systems.
The difference between reporting and insight is the willingness to join dots across time, context and human behavior.
That is where analytics stops being a dashboard.
And starts becoming a leadership instrument.
Leave a Reply