


Dashboards are designed wrong when they prioritize visuals and metrics over decisions, missing context, ownership and clear actionability.
This article is not an argument against dashboards or visual analytics. On the contrary, dashboards are among the most powerful tools organizations have to improve decision-making. When designed well, they can reduce uncertainty, sharpen judgment, surface risks early and guide leaders toward better choices.
The problem isn’t visualization. The problem is how dashboards are currently designed. They are optimized for reporting, not for decisions.
In this piece, we take insight a step further — shifting the focus from reporting to decision design.
What follows is not a critique of dashboards (I love them a lot), but a blueprint for how organizations can evolve dashboards from passive reporting tools into active decision systems.
Dashboards Are Not the Problem. Decision Design Is.
Across organizations, I’ve seen dashboards become more sophisticated over time. More data sources. Better visuals. Faster refresh cycles. More filters. More automation.
Every aspects of building a modern dashboard is getting ticked. And yet, the quality of decisions often hasn’t improved at the same pace.
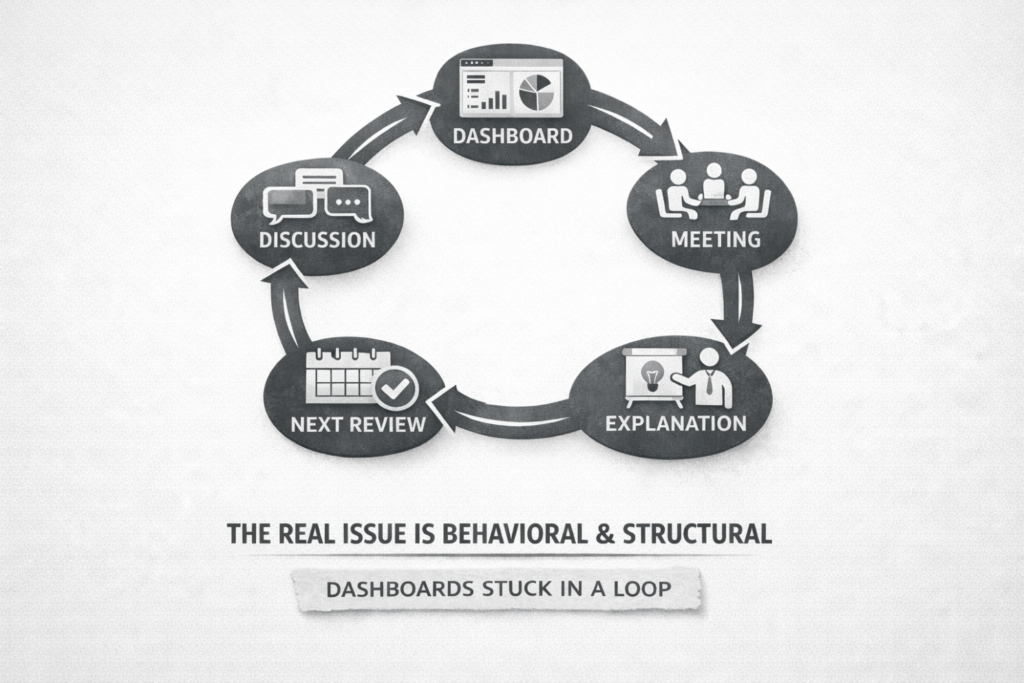
Leadership teams still revisit the same problems quarter after quarter. The same underperforming initiatives linger. The same trade-offs get postponed. The same risks remain visible but unresolved.
This disconnect is rarely a data issue. More often, it’s a decision design issue.
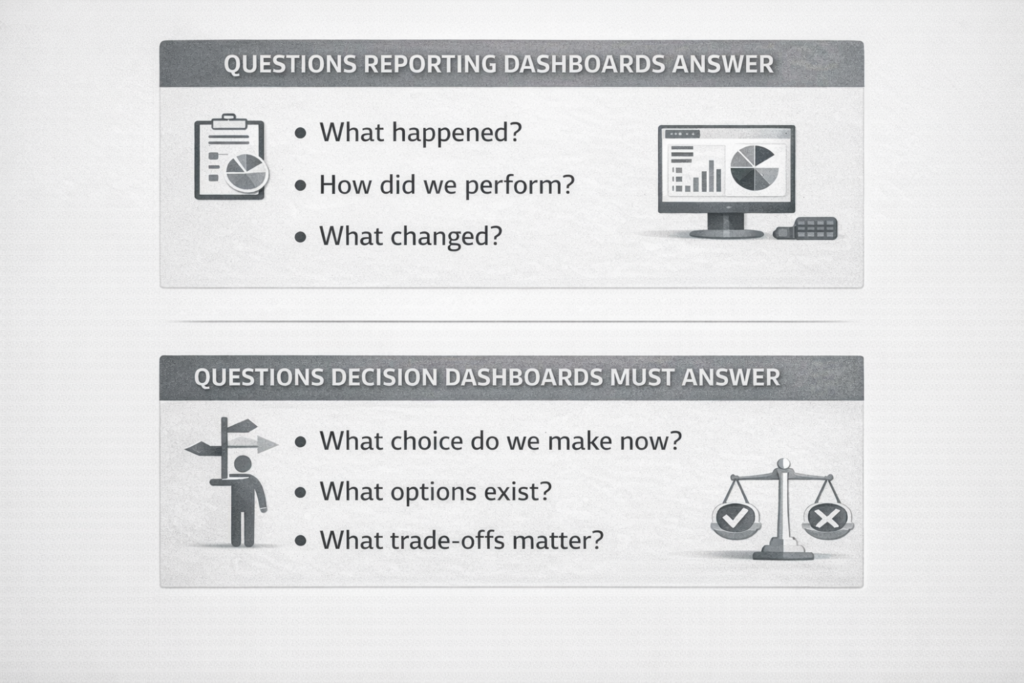
Dashboards today are very good at answering questions like: “What happened?” “How did we perform?” “Where did we miss targets?”
But decision-makers usually need answers to a different set of questions: “What choice should we make now?” “What are our real options?” “What are the trade-offs?” “What will happen if we delay?”
Most dashboards describe reality. Very few are built to shape decisions about the future.
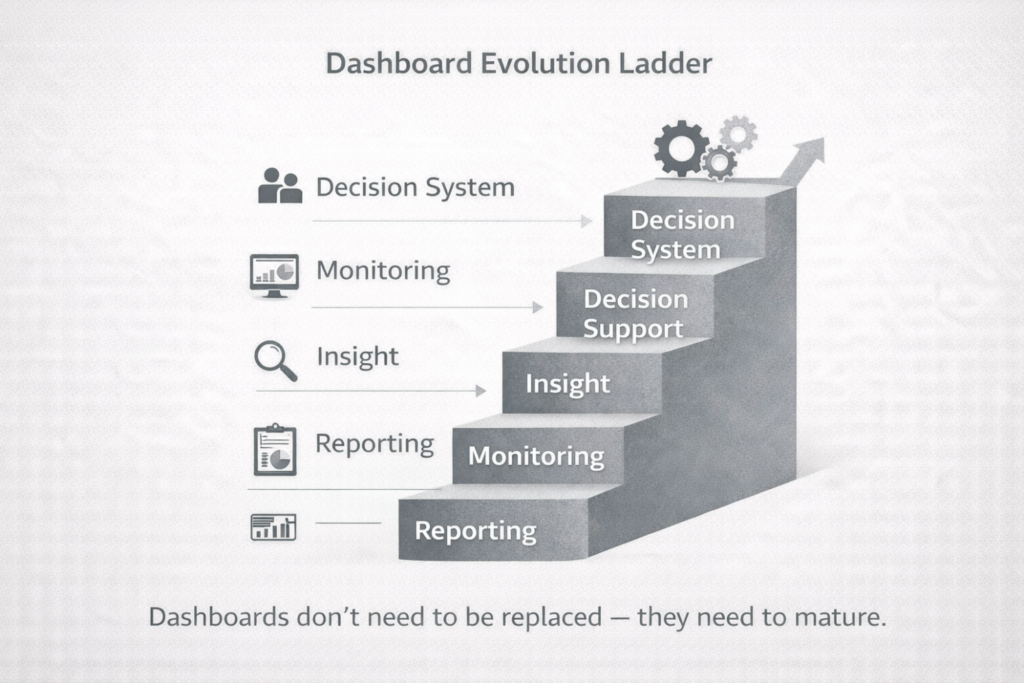
How Dashboards Drifted Into Reporting Tools
Dashboards didn’t start out as decision systems. They evolved from management reporting e.g. financial scorecards, operational reviews, KPI trackers and executive summaries.
That origin shaped how they were designed i.e. to measure, monitor and explain performance.
Over time, the reporting layer became more dynamic and interactive, but the underlying purpose remained the same, which is – tracking what happened, not guiding what to do next.
As a result, many dashboards today function more like performance mirrors than decision instruments.
They show leaders what’s going on. They rarely tell leaders what to do about it.
Visibility Does Not Automatically Lead to Better Decisions
There is an implicit assumption in many organizations: “If leaders can see the data, they will make better decisions.”
In reality, visibility alone does not change behavior.
I’ve sat in executive reviews where dashboards were clear, accurate and well-designed and yet decisions were still delayed. More analysis was requested. More validation was sought. More meetings were scheduled.
Not because the data was unclear, but because ownership, incentives, and decision authority were unclear.
Dashboards can surface insight. But insight only creates impact when someone is accountable for acting on it.
Without clear decision ownership, dashboards often end up fueling discussion rather than driving action.
The Cost of Dashboards That Don’t Influence Decisions
Dashboards that are designed primarily for reporting impose subtle but real costs on organizations.
- Leadership attention gets spread thin across too many metrics.
- Decision cycles slow down because conversations focus on explaining performance rather than changing it.
- Teams spend time preparing reports instead of solving problems.
- Known risks remain visible but unresolved because no one feels empowered or obligated to act.
Over time, dashboards that fail to influence decisions can actually reduce organizational agility, even if they increase transparency.
The issue is not that dashboards exist. It’s that they are not designed to meaningfully alter choices.
The Difference Between Reporting Dashboards and Decision Dashboards
A reporting dashboard is built to summarize performance. It tracks metrics, highlights variances and shows trends over time.
A decision dashboard is built to support a specific choice.
The difference is subtle but critical.
A reporting dashboard answers: “What is the status?”
A decision dashboard answers: “What should we do next?”
Instead of simply showing outcomes, a decision-oriented dashboard surfaces drivers, levers and options. It helps leaders understand what they can influence, what trade-offs exist and what actions are likely to have the greatest impact.
It doesn’t just inform. It guides judgment.
Why Many Dashboards Fail to Change Behavior
In many organizations, dashboards exist in isolation from real decision-making processes.
They are reviewed in meetings, discussed in presentations and circulated in emails but they are not embedded into how decisions are actually made.
If a dashboard reveals a problem but no one is explicitly accountable for fixing it, the insight remains informational.
If a dashboard highlights an opportunity but no one owns the decision to act on it, the opportunity fades.
Dashboards influence outcomes only when they are connected to clear decision rights, defined owners and agreed action thresholds.
Without that link, dashboards become reference material rather than decision tools.
From Outcomes to Levers, What Better Dashboards Show
Most dashboards emphasize outcomes e.g. revenue, costs, growth, churn, efficiency, satisfaction.
Outcomes matter, but they are not directly actionable.
What leaders need, especially under uncertainty, is visibility into what they can actually change.
For example, it is useful to know that customer churn increased. It is far more powerful to know why churn increased, which segments are most at risk, and which interventions are likely to reduce it.
Dashboards that surface drivers and controllable levers move leaders from passive awareness to active decision-making.
They don’t just show what happened. They help leaders understand where intervention will matter most.
When Dashboards Should Trigger Action, Not Just Discussion
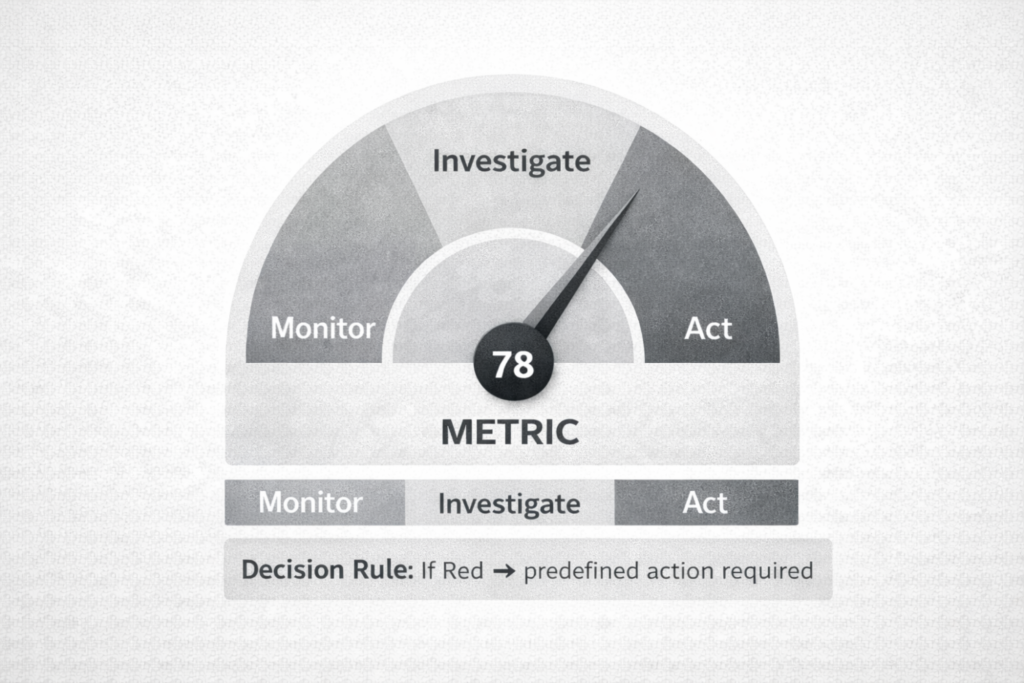
Another limitation of many dashboards is that they show trends but fail to define when action is required.
Leaders see metrics moving, but the organization hasn’t agreed on what movement actually warrants intervention.
As a result, changes become topics for discussion rather than triggers for decisions.
Decision-oriented dashboards define thresholds, risk levels, or trigger points that prompt predefined responses. When a metric crosses a meaningful boundary, the question is no longer “Should we act?” — it becomes “What action do we take?”
This reduces ambiguity and shortens the gap between insight and execution.
Designing Dashboards Around Decisions, Not Metrics
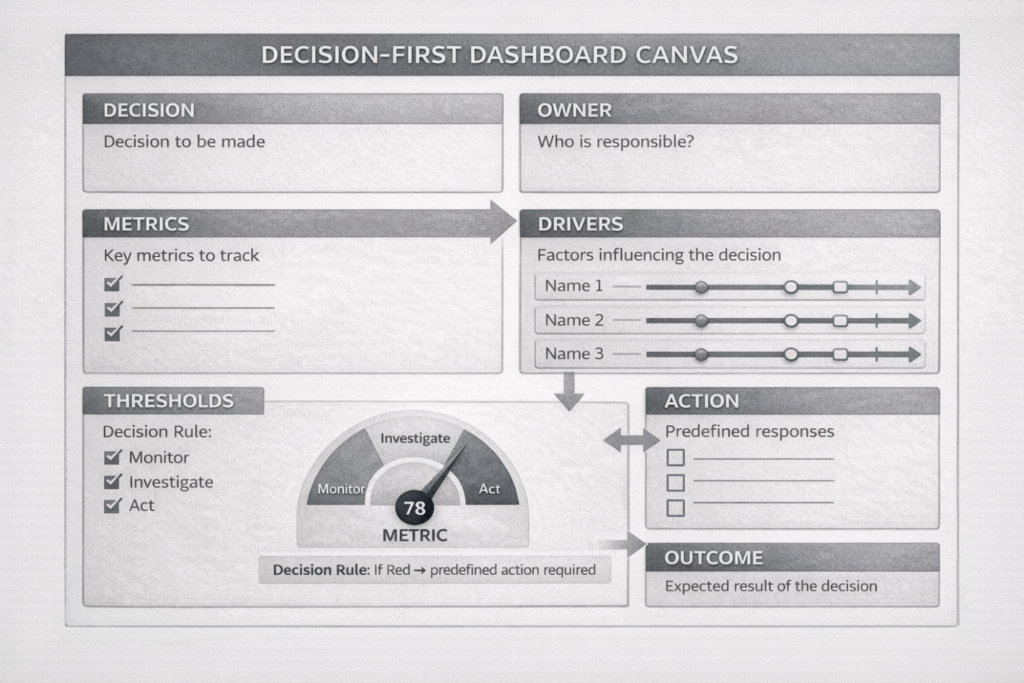
One of the most effective shifts organizations can make is to start dashboard design with a decision, not a KPI list.
Instead of asking, “What metrics should we track?” Ask, “What decision are we trying to support?”
Once the decision is clear, the rest follows more naturally. What information reduces uncertainty for that decision? What drivers influence the outcome? What trade-offs does leadership need to evaluate? What would success look like after the decision is made?
Dashboards designed around decisions feel fundamentally different. They are more focused. More intentional. More actionable.
They don’t try to show everything. They show what matters for a specific choice.
The Leadership Shift Required
For dashboards to become decision systems, leadership behavior must evolve.
This means using dashboards not just to monitor results, but to make difficult choices. It means being willing to act on uncomfortable insights. It means shifting executive meetings from status updates toward decision-making sessions.
Dashboards can surface truth. But leaders determine whether truth leads to action.
Without leadership commitment to act on insight, even the best-designed dashboards will remain underutilized.
The Analytics Shift Required
Analytics teams also have an opportunity to evolve.
Instead of positioning themselves as report builders, they can become decision partners, helping business leaders frame choices, understand trade-offs and quantify impact.
This requires moving beyond descriptive reporting into deeper analytical work: understanding drivers, modeling scenarios, quantifying risks and translating data into decision-ready insight.
The goal is not more analysis. The goal is analysis that meaningfully improves decisions.
Practical Blueprint From Reporting to Decision Systems
Here’s a simple test I recommend to leaders:
Before building or reviewing a dashboard, ask:
- What decision is this supposed to influence?
- Who owns that decision?
- What levers can they actually pull?
- What threshold forces action?
- How will we measure whether the decision worked?
If these five answers aren’t clear, the dashboard is likely informational — not transformational.
What High-Performing Organizations Do Differently
In organizations where dashboards genuinely influence decisions, the pattern is consistent.
- Dashboards are treated as part of a broader decision system, not as standalone reporting tools.
- Ownership is explicit as someone is accountable for acting on what the dashboard reveals.
- Leaders use dashboards to make trade-offs, not just to review performance.
- Analytics teams focus on supporting decisions, not just producing reports.
The emphasis is not on how dashboards look. It is on whether dashboards change behavior and outcomes.
Closing Thought
Dashboards are not the enemy of good decision-making. Poorly designed dashboards are.
When dashboards are built to report, they inform. When dashboards are built to decide, they transform.
Organizations do not need fewer dashboards. They need dashboards that are worthy of the decisions leaders must make.
Because dashboards alone do not create impact. Decisions do.
Leave a Reply