


The reason executives struggle to get answers isn’t because data is missing. It’s because analytics is organized differently from how the business actually works.
Over the last decade, organizations have invested billions in ERP systems, CRM platforms, cloud data warehouses, business intelligence tools, and advanced analytics capabilities. Executives have been promised unprecedented visibility into their operations. Every major function now has dashboards, scorecards, reports, and real-time metrics. Data has become one of the most discussed assets in the enterprise.
Yet despite these investments, a surprisingly common problem persists.
When a critical business issue emerges, obtaining a clear answer often requires multiple meetings, data extractions from different systems, manual reconciliation, and extensive discussions across departments.
Consider a common scenario.
A strategic customer reports that an order is three weeks late. The organization possesses data at every stage of the journey. Sales can see when the order was booked. Procurement can track supplier deliveries. Production can monitor manufacturing schedules. Logistics can verify shipment movements. Finance can review invoicing and payment status.
Despite this abundance of information, leadership teams frequently struggle to answer a seemingly simple question:
Why is the customer’s order delayed?
The challenge is rarely the absence of data. In most cases, organizations possess more data than they know what to do with.
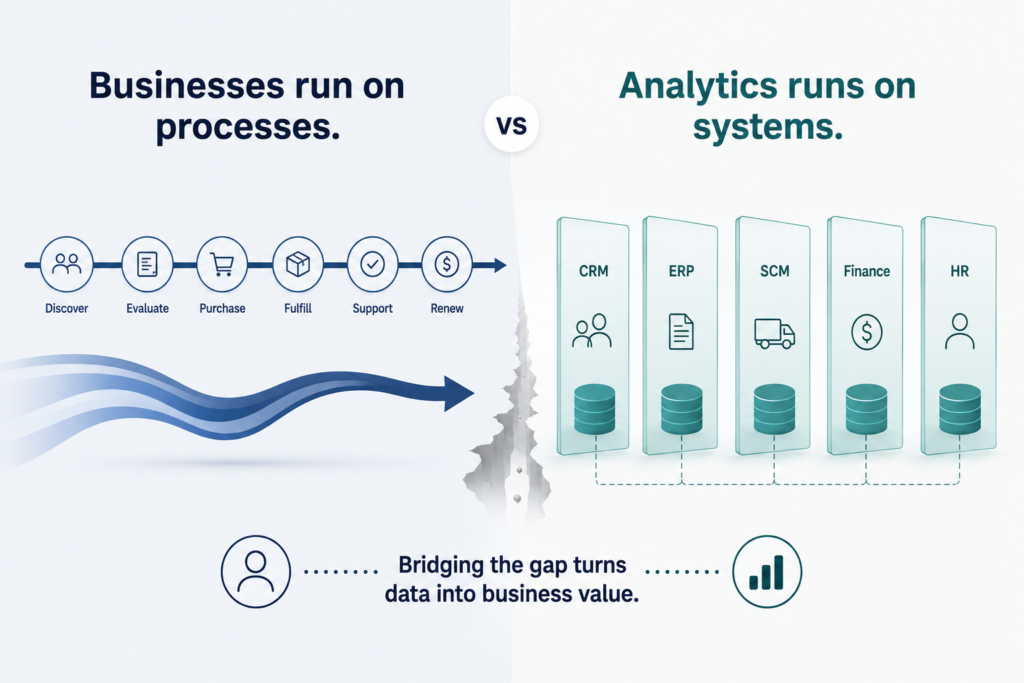
The real issue is that businesses operate through processes, while analytics is typically organized around systems and functions. Decisions become trapped in the gap between how value flows through the organization and how information is measured within it.
This distinction may appear subtle, but it explains why many organizations remain information-rich yet insight-poor.
The Structural Misalignment Between Business Processes and Analytics
Most organizations are designed around functions. Sales, marketing, procurement, operations, finance, customer service, and human resources each have distinct responsibilities, leadership structures, budgets, and performance metrics.
Technology evolves in a similar manner.
Sales teams adopt CRM platforms. Finance teams operate ERP modules. Procurement uses supplier management systems. Manufacturing relies on production planning and execution systems. Customer support manages ticketing applications.
Over time, analytics naturally follows the same path.
Organizations build:
- Sales dashboards
- Finance dashboards
- Procurement dashboards
- Operations dashboards
- Customer service dashboards
From an organizational perspective, this approach seems logical. Each department receives visibility into its own performance and can monitor its own objectives.
However, this structure introduces a fundamental disconnect.
While organizations are managed through functions, value is delivered through processes.
Customers do not experience organizational charts.
They experience journeys.
A customer purchasing a product experiences a continuous sequence of events—from initial inquiry to order placement, production, fulfillment, delivery, invoicing, and support. The customer does not distinguish between sales, operations, logistics, and finance. To them, it is a single experience.
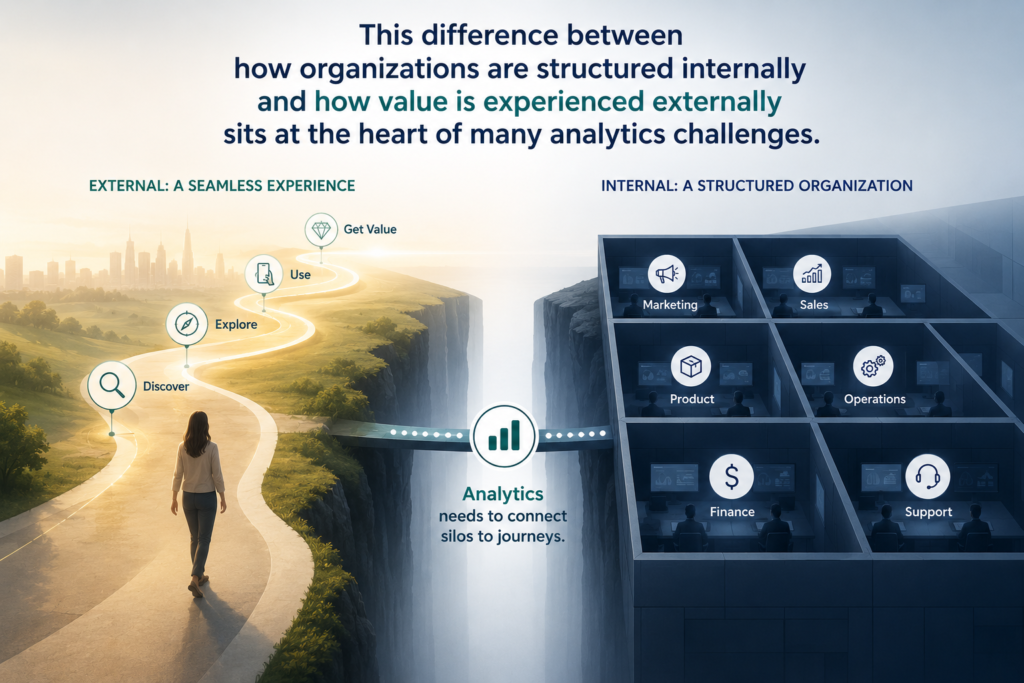
This difference between how organizations are structured internally and how value is experienced externally sits at the heart of many analytics challenges.
When dashboards mirror departmental boundaries instead of business processes, organizations gain visibility into activities but lose visibility into outcomes.
Why Businesses Experience Problems That Dashboards Cannot Explain
One of the most overlooked realities in analytics is that most executive questions are inherently cross-functional.
Consider some of the questions leadership teams ask most frequently:
- Why are customers leaving?
- Why are margins declining?
- Why is working capital increasing?
- Why are order cycle times growing?
- Why are service levels deteriorating?
None of these questions can be answered within a single department.
Customer attrition may involve sales practices, product quality, service responsiveness, pricing decisions, and operational performance.
Margin erosion may stem from procurement costs, production inefficiencies, discounting strategies, supply chain disruptions, and customer mix changes.
Working capital may be influenced by inventory policies, procurement decisions, production planning, collections effectiveness, and supplier payment terms.
The challenge is that while the questions are cross-functional, the analytics environment is often not.
Most dashboards operate within invisible boundaries.
They provide visibility into specific functions but struggle to explain what happens when work flows across those functions.
As a result, organizations frequently find themselves looking for answers in places where those answers cannot possibly exist.
The Airport Analogy: Understanding the Difference Between Functions and Journeys
A useful analogy is the modern airport.
Passengers care about one outcome: reaching their destination safely and on time.
Behind the scenes, however, the journey involves numerous independent functions.
These include:
- Security screening
- Immigration processing
- Airline operations
- Ground handling
- Baggage management
- Air traffic control
Each function has its own objectives, metrics, systems, and operating procedures.
Now imagine if airport analytics resembled the reporting structure found in many enterprises.
The airport leadership team would review:
- Security performance dashboards
- Immigration dashboards
- Baggage handling dashboards
- Airline operations dashboards
Each department could report excellent performance.
Security clearance times are low. Baggage accuracy exceeds targets. Immigration processing remains efficient.
Yet passengers continue missing flights.
Why?
Because no one is measuring the passenger journey itself.
The passenger’s experience exists across organizational boundaries. Optimizing individual functions does not automatically optimize the overall journey.
Business processes operate in exactly the same way.
Customers experience outcomes. Organizations often measure activities.
The distinction matters more than many leaders realize.
The Hidden Cost of Functional Dashboards: Local Optimization
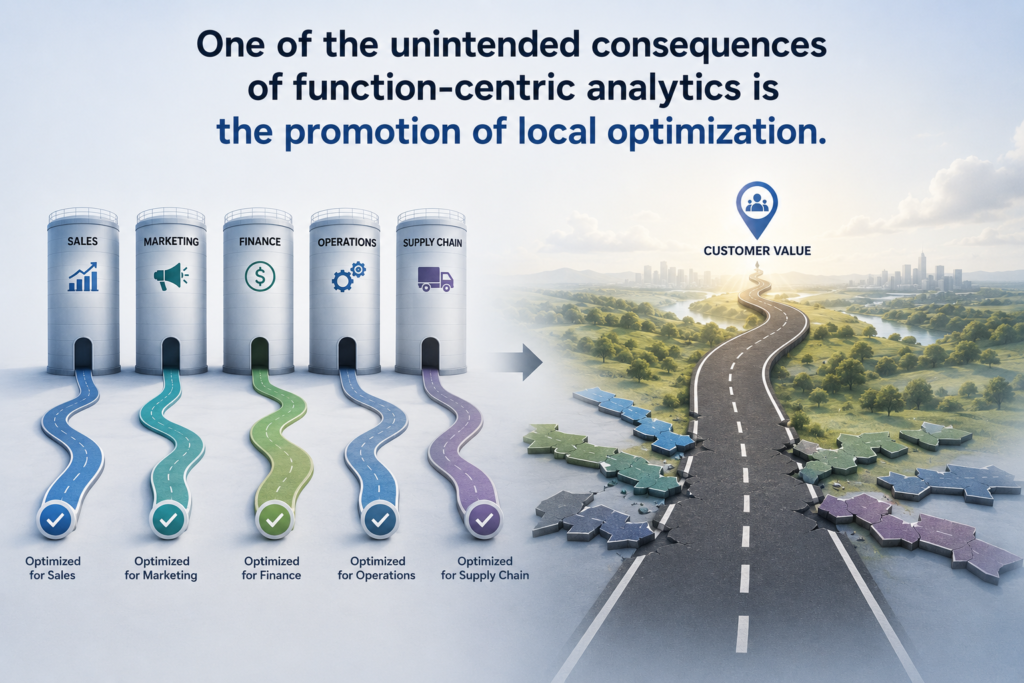
One of the unintended consequences of function-centric analytics is the promotion of local optimization.
Every department becomes highly effective at improving its own metrics.
- Procurement focuses on reducing supplier costs.
- Manufacturing focuses on maximizing equipment utilization.
- Warehousing focuses on inventory availability.
- Finance focuses on improving working capital.
Viewed individually, these objectives appear entirely reasonable.
The problem emerges when departmental success comes at the expense of overall business performance.
A procurement team may successfully negotiate lower supplier prices. However, those suppliers may have inconsistent quality standards or longer lead times.
Production may increase machine utilization by scheduling larger batch sizes. However, this may increase inventory levels and reduce responsiveness to customer demand.
Finance may aggressively reduce inventory to improve balance sheet metrics. However, this may increase stock-outs and damage customer satisfaction.
This phenomenon is often described in systems thinking as sub-optimization—the improvement of individual components that ultimately weakens the performance of the larger system.
The dashboard reports success.
The business experiences failure.
The root cause is that organizations are measuring the performance of activities rather than the effectiveness of the process.
Why Digital Transformation Has Not Solved This Problem
Many organizations assumed digital transformation would eliminate these challenges.
After all, businesses have spent years implementing ERP systems, CRM platforms, cloud technologies, data lakes, and advanced analytics platforms.
Yet process visibility remains elusive.
The reason is straightforward.
Most digital transformation initiatives focused on digitizing activities rather than understanding processes.
Organizations successfully automated transactions.
- They integrated applications.
- They modernized infrastructure.
- They improved data accessibility.
What they often failed to do was create visibility into how work actually moves across the enterprise.
Technology projects frequently focus on system integration.
Business leaders, however, need process integration.
The distinction is critical.
A company may successfully integrate CRM, ERP, and supply chain systems while still lacking the ability to answer questions such as:
- Where do orders typically get delayed?
- Which process handoffs create the most friction?
- Where does customer experience deteriorate?
- Which activities contribute most to cycle time?
Digital transformation can improve efficiency without improving understanding.
That is precisely what many organizations are experiencing today.
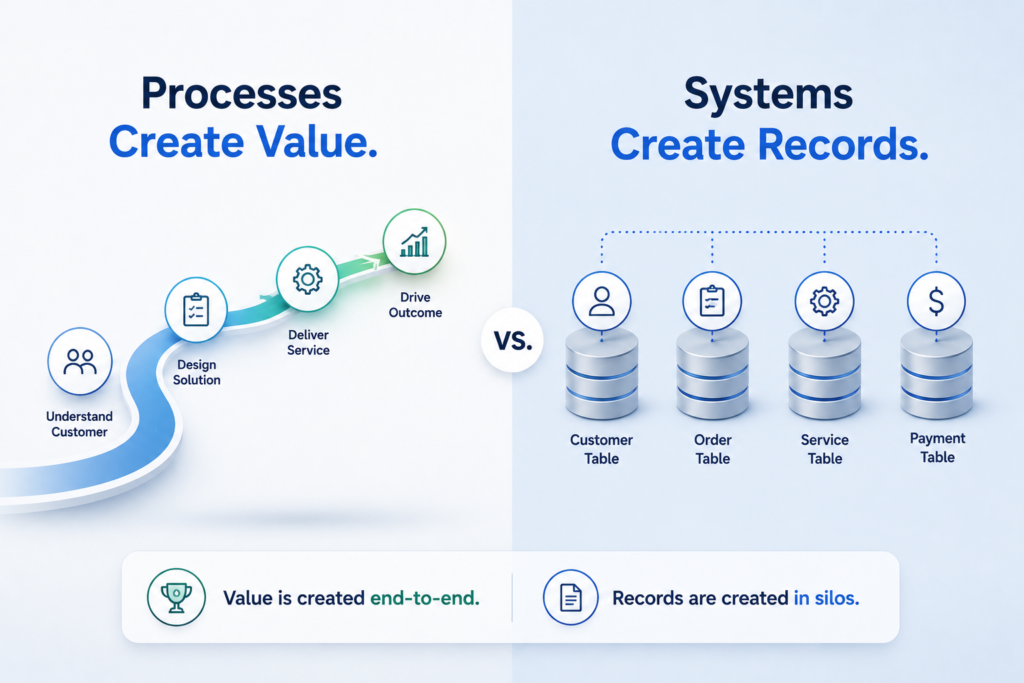
Processes Create Value. Systems Create Records
One of the most important concepts in modern analytics is understanding the difference between value creation and activity recording.
Business processes create value. Systems record activities.
Consider the Order-to-Cash process.
From the customer’s perspective, the objective is straightforward. They place an order, receive the product, and complete payment.
Internally, however, numerous systems become involved.
- A CRM captures the sales order.
- An ERP processes transactions.
- Manufacturing systems manage production.
- Warehouse systems manage inventory.
- Logistics applications coordinate delivery.
- Finance systems generate invoices and track collections.
Although the process is singular, the systems are fragmented.
Most organizations measure the fragments.
Far fewer measure the journey.
As a result, leaders gain extensive visibility into what happened within individual systems while struggling to understand what happened to the customer.
The organization becomes highly informed about activities yet remains surprisingly uninformed about outcomes.
Why Executives Continue to Rely on Excel
Analytics teams often view spreadsheet usage as evidence that dashboards are not being adopted.
In reality, spreadsheets frequently reveal a much deeper problem.
Executives are often attempting to reconstruct processes that have been fragmented across multiple reporting environments.
- A sales dashboard provides one perspective.
- An operations dashboard provides another.
- A finance dashboard offers a third.
To understand what is actually happening, leaders often combine information manually. The spreadsheet becomes a temporary mechanism for rebuilding the end-to-end process.
What appears to be resistance to analytics is frequently a demand for process visibility.
Executives are not rejecting dashboards because they prefer spreadsheets. They are using spreadsheets because dashboards frequently fail to reflect how the business actually operates.
This distinction is important because it changes the solution. The answer is not necessarily a better dashboard.
The answer is often a better representation of the business process itself.
The Amazon Principle: Customers Think in Processes
Modern digital leaders provide an important lesson.
When customers place an online order,
- They do not think in terms of operational functions.
- They do not ask about warehouse efficiency.
- They do not ask about transportation utilization.
- They do not ask about payment processing metrics.
Instead, they ask a single question:
Where is my order?
This is fundamentally a process question. Customers want visibility into the journey. The most successful digital experiences recognize this reality. They present information in the context of the customer’s process rather than the organization’s structure.
Customers see order progress. They see milestones. They see expected delivery dates. They see exceptions and delays. The complexity of the underlying organization remains hidden.
Ironically, while many organizations have mastered process-centric customer experiences, they continue to operate internally using function-centric analytics.
This creates a significant gap between how customers experience the business and how leaders measure it.
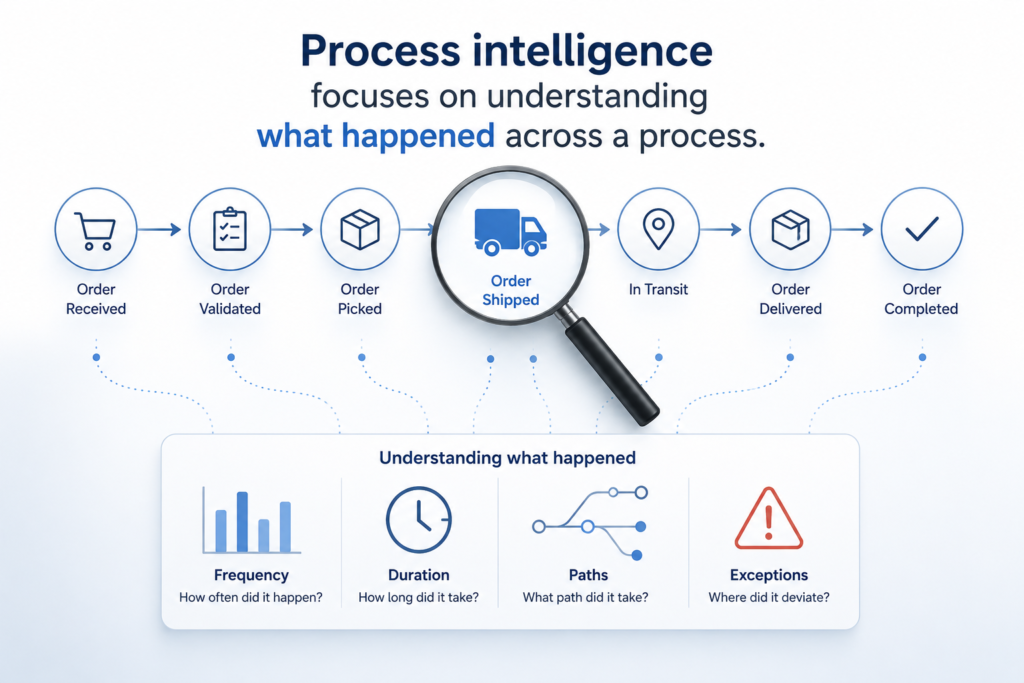
The Rise of Process Intelligence
This challenge has led to growing interest in process intelligence. Traditional business intelligence focuses on understanding what happened inside a function.
Process intelligence focuses on understanding what happened across a process. The difference may appear subtle, but it fundamentally changes the unit of analysis.
Traditional reporting asks:
- How efficient is procurement?
- How productive is manufacturing?
- How effective is logistics?
Process intelligence asks:
- How long does it take to fulfill an order?
- Where do delays occur?
- Which process variants create the best outcomes?
- Which handoffs introduce risk?
Instead of measuring individual activities, organizations begin measuring the flow of work itself. The focus shifts from functional efficiency to process effectiveness. This shift changes conversations across the organization. Departments stop defending isolated metrics. Leadership teams begin discussing shared outcomes.
Analytics becomes aligned with value creation rather than organizational structure.
What a Process-Centric Dashboard Really Looks Like
A process-centric dashboard is not defined by visual design. It is defined by the questions it answers.
For an Order-to-Cash process, leaders might ask:
- Where are orders currently waiting?
- Which stage contributes most to overall cycle time?
- Which customers experience the longest delays?
- What percentage of orders flow through the process without intervention?
- Where do exceptions occur most frequently?
For Procure-to-Pay:
- Which approvals create bottlenecks?
- Which suppliers generate the most disruption?
- How much time is lost between requisition and purchase order creation?
- Which process paths consistently outperform others?
Notice how these questions naturally span multiple departments. The dashboard is no longer organized around organizational ownership. It is organized around business outcomes.
That is the essence of process-centric analytics.
The Real Challenge Is Governance, Not Technology
Most discussions about analytics focus on technology. In reality, the greatest barrier to process-centric reporting is often governance. Functions have clear ownership.
There is a Head of Sales. A CFO. A Procurement Director. A Supply Chain Leader. Ownership is well defined. Processes are different.
- Who owns Order-to-Cash?
- Who owns Customer Experience?
- Who owns Forecast-to-Fulfillment?
- Who owns Product Launch?
In many organizations, the answer is unclear. Processes span multiple functions, but authority often does not. As a result, process-level accountability becomes difficult to establish.
This explains why functional dashboards remain dominant. They align naturally with organizational structures, budgets, and reporting relationships.
Process dashboards challenge those structures because they expose performance across departmental boundaries. The obstacle is not technology.
The obstacle is organizational design.
Conclusion: The Future of Analytics Lies Between Systems
For decades, organizations have measured functions because functions were the easiest units to observe and manage. However, as competition increasingly depends on customer experience, operational agility, speed, and resilience, this approach is becoming insufficient.
The future of analytics will not be defined by more dashboards, more KPIs, or more sophisticated visualization tools. It will be defined by a shift in perspective.
Organizations must move from measuring functions to measuring processes.
This distinction is far more significant than it appears.
Functional metrics explain how departments perform. Process metrics explain how value is created.
The most important business questions rarely reside within a single application, department, or dashboard. They emerge at the intersections where information, decisions, products, and customers move across the enterprise.
Those intersections remain largely invisible in many reporting environments today.
Organizations that learn to measure them effectively will gain a significant advantage. They will understand not only what happened within individual functions, but also how value flowed across the entire business.
And in an increasingly complex business environment, that understanding may become one of the most important competitive advantages of all.
Leave a Reply