


Despite decades of BI innovation, Excel endures because business decisions are iterative, messy and require flexibility beyond dashboards.
For more than two decades, technology vendors have repeatedly predicted the demise of Excel. Every new wave of Business Intelligence promised to eliminate spreadsheets.
From enterprise reporting platforms to self-service analytics tools, the narrative remained remarkably consistent: dashboards would replace workbooks, governed data models would replace manual analysis, and users would eventually abandon spreadsheets.
Yet that prediction never materialized.
Today, organizations run sophisticated BI environments powered by cloud data platforms, semantic layers, and interactive dashboards. At the same time, Excel continues to occupy a central place in finance, operations, procurement, supply chain, and planning functions.
This is not because enterprises resisted innovation. Nor is it because users refused to learn new tools.
Excel survived because the BI revolution misunderstood how businesses actually make decisions.
BI Tools Excel at Visualization. Excel Excels at Decision Support
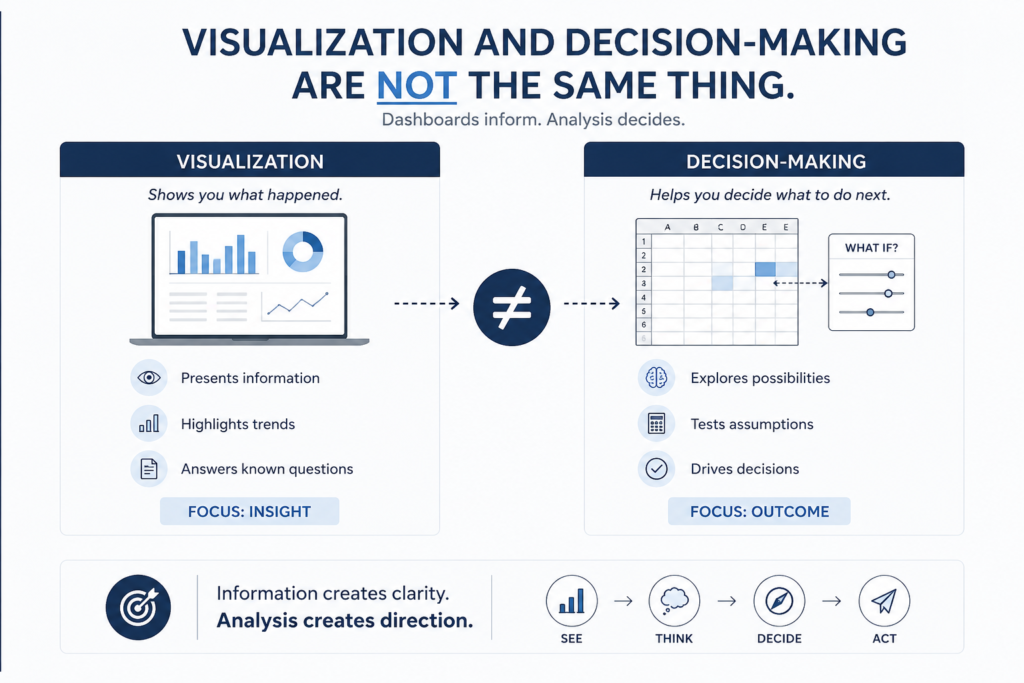
Business Intelligence platforms are exceptional at presenting information. They consolidate data from multiple sources, standardize metrics, and enable organizations to consume information at scale.
But visualization and decision-making are not the same thing.
Executives rarely stop after viewing a dashboard. One question inevitably leads to another.
- Why did margins decline?
- What happens if prices are adjusted?
- How would inventory levels change under different assumptions?
- Can we isolate exceptions?
- Can allocations be modified?
These are not dashboard questions. They are analytical questions.
Business decisions are rarely linear. They involve experimentation, scenario modeling, and continuous refinement. In this environment, Excel offers something dashboards struggle to provide: freedom to think through a problem rather than simply observe it.
Dashboards tell people what happened. Spreadsheets help them decide what to do next.
Most Analytical Work Happens Before Visualization
Many organizations view dashboards as the center of analytics. In reality, a significant portion of analytical effort occurs long before data reaches a chart or KPI.
Analysts spend time:
- Validating data.
- Reconciling numbers.
- Handling exceptions.
- Creating business rules.
- Adjusting assumptions.
- Performing one-off calculations.
These activities are rarely glamorous, yet they represent the essence of business analysis.
A dashboard may display inventory aging, but someone has to determine how aging buckets should be defined. A report may present procurement savings, but someone must establish the underlying methodology.
In many organizations, Excel remains the environment where these decisions are made.
If dashboards are the showroom, spreadsheets are the workshop. And workshops tend to survive because real work happens there.
Business Processes Are Messier Than Software Architects Expect
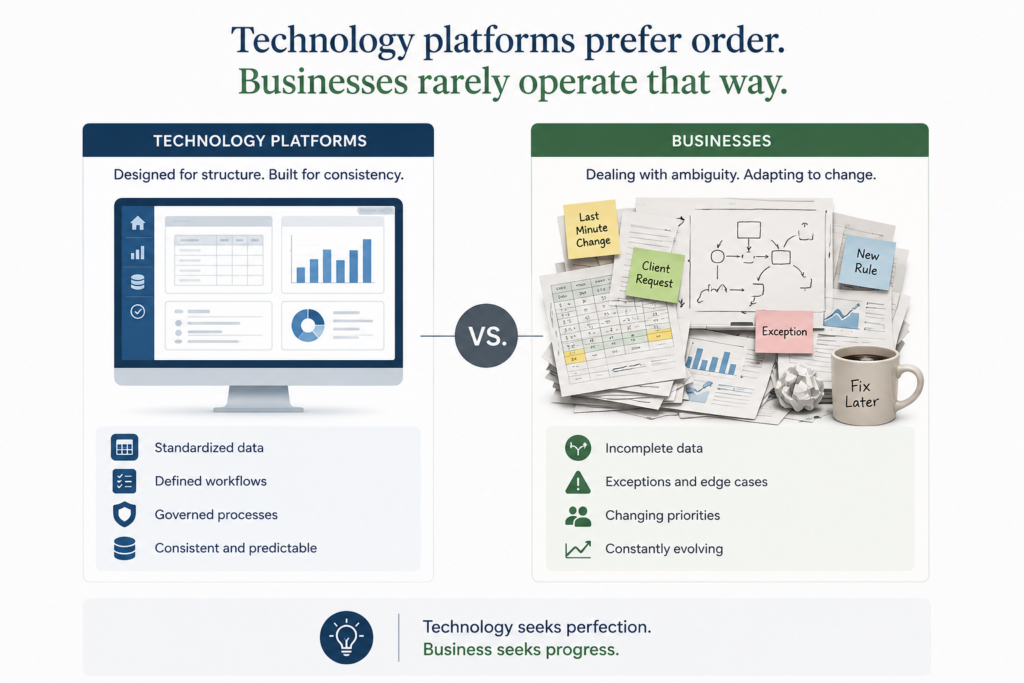
Technology platforms prefer order. Businesses rarely operate that way.
Organizations constantly deal with:
- Incomplete master data.
- Exceptional transactions.
- Regulatory changes.
- Temporary workarounds.
- New pricing models.
- Changing assumptions.
The real world rarely conforms to perfect data structures.
This explains why spreadsheets continue to thrive. Excel does not require everything to be perfect before work can begin. It accommodates ambiguity, exceptions, and evolving requirements.
Month-end closing provides an excellent example. Every finance leader understands that adjustments, reclassifications, and reconciliations are part of the process. Supply chain planners face similar realities when dealing with shortages, changing demand patterns, and emergency procurement requirements.
Business processes are dynamic. Excel’s flexibility allows it to evolve with those processes.
Excel Was Low-Code Before Low-Code Became Fashionable
In recent years, the technology industry has enthusiastically embraced the concept of low-code platforms. Vendors position these environments as revolutionary because they empower business users to create solutions without extensive programming knowledge.
But business users have been doing precisely that for decades.
Through formulas, pivot tables, lookup functions, Power Query, and macros, finance and operations professionals have effectively acted as citizen developers long before the term became popular.
Without writing traditional code, users have built:
- Financial models.
- Forecasting systems.
- Allocation engines.
- Reconciliation frameworks.
- Operational trackers.
- Scenario planning tools.
In many ways, Excel became the world’s largest low-code platform without ever marketing itself as one. Its success came not from technological sophistication but from accessibility.
People could solve problems without waiting for IT. And speed often matters more than elegance.
Flexibility Frequently Wins Over Governance
Executives frequently emphasize concepts such as:
- Single source of truth.
- Standardization.
- Governance.
- Controlled reporting.
These objectives are undoubtedly important.
However, business users often optimize for something entirely different.
They value:
- Speed.
- Independence.
- Responsiveness.
- Adaptability.
This creates a natural tension between governance and agility.
From an IT perspective, standardization reduces complexity. From a business perspective, excessive rigidity can slow down decision-making.
When deadlines are approaching and markets are changing, users frequently prioritize productivity over perfection.
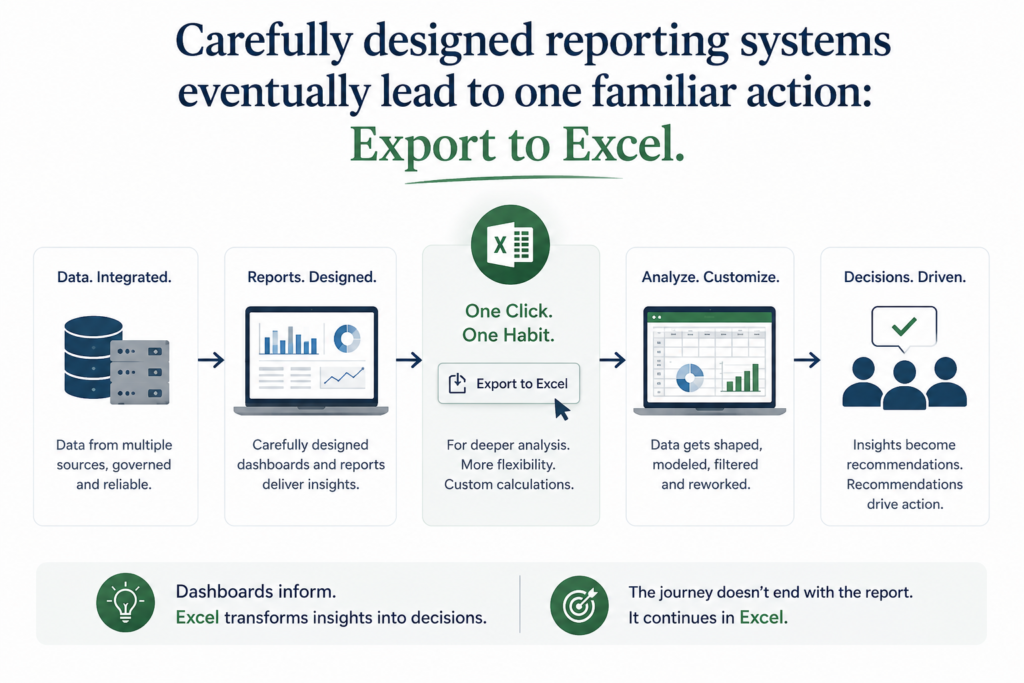
This explains why so many carefully designed reporting systems eventually lead to one familiar action: Export to Excel.
Not because users dislike dashboards. But because they need flexibility that dashboards alone cannot provide.
BI Adoption Often Creates More Spreadsheet Usage
One of the great ironies of modern analytics is that many BI initiatives have actually increased spreadsheet activity.
The workflow is surprisingly common. Data enters the warehouse. Dashboards visualize the metrics. Users export the information. Additional calculations are performed. Exceptions are analyzed. Scenarios are created. Reports are prepared. The final recommendations are presented.
The process does not end with the dashboard. In many cases, the dashboard simply becomes the starting point. This reality is often ignored because it contradicts the traditional narrative of analytics maturity.
Organizations do not move from spreadsheets to dashboards. They evolve toward ecosystems where both coexist.
The question is no longer whether Excel should disappear.
The more relevant question is how spreadsheets can be integrated into modern architectures in a controlled and effective manner.
Excel Is More Than Software. It Is the Language of Business
One reason spreadsheets continue to endure is that they represent something larger than a tool. They represent a common language.
- Finance teams communicate through spreadsheets.
- Operations teams communicate through spreadsheets.
- Supply chain professionals communicate through spreadsheets.
- Procurement teams communicate through spreadsheets.
Because nearly everyone understands the format, information flows naturally across functions. This universality creates enormous value.
An Excel file can be opened by an analyst in Mumbai, a controller in London, and an operations manager in Chicago without requiring specialized skills or software expertise.
Few technologies achieve this level of familiarity.
Just as PDF became the standard format for documents, Excel became the standard format for analysis.
Replacing a language is considerably more difficult than replacing a tool.
Human Trust Matters More Than Vendors Appreciate
Another reason behind Excel’s longevity lies in trust.
Business leaders often want to understand how numbers are derived. They want to inspect formulas. They want visibility into intermediate calculations. They want to trace assumptions.
Dashboards are powerful, but they frequently hide complexity behind attractive visualizations. Spreadsheets expose that complexity.
This transparency creates confidence.
In highly regulated industries, auditability and explainability are critical. Finance teams, internal auditors, and compliance functions prefer environments where calculations can be examined and verified.
People trust what they can see. And spreadsheets allow users to see almost everything.
That transparency remains one of Excel’s greatest competitive advantages.
The Problem Was Never Excel. It Was Unmanaged Excel
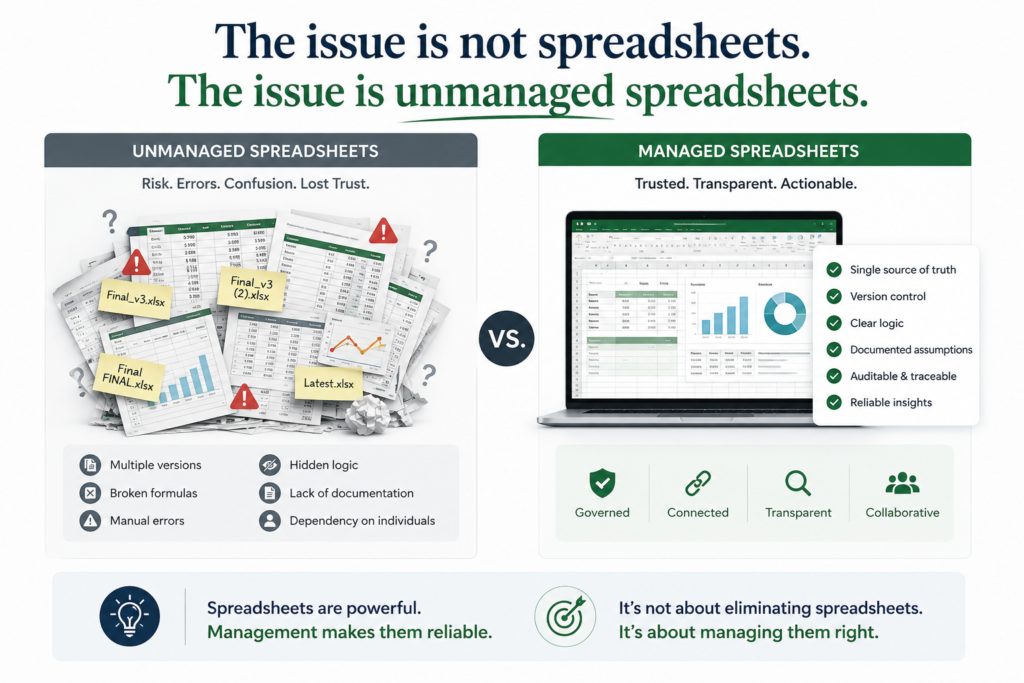
Critics often point to broken formulas, multiple versions, and manual errors as evidence that spreadsheets should disappear.
But these problems do not originate from Excel itself.
They originate from poor practices.
Bad spreadsheet management leads to:
- Version confusion.
- Hidden formulas.
- Copy-paste errors.
- Lack of documentation.
- Dependency on individuals.
These issues are real.
However, abandoning Excel is not necessarily the answer. The better approach involves introducing discipline.
Structured models, documented assumptions, connected datasets, Power Query, and governance frameworks can transform spreadsheets from liabilities into powerful analytical assets.
The issue is not spreadsheets. The issue is unmanaged spreadsheets.
Blaming Excel for governance failures is similar to blaming email for poor communication practices.
AI May Strengthen Excel Rather Than Replace It
Many observers believe Artificial Intelligence will finally eliminate spreadsheets. History suggests otherwise. Technology rarely destroys successful platforms overnight. More often, it enhances them.
AI is already making spreadsheet users more productive. Formula generation becomes easier. Complex calculations become accessible. Data cleansing becomes faster. Pattern detection improves. Natural language interactions simplify analysis.
Instead of reducing spreadsheet usage, AI may democratize analytical capabilities even further.
People who previously struggled with advanced formulas can now perform sophisticated analyses with minimal effort.
In that sense, AI could become an accelerator for spreadsheet adoption rather than a replacement.
The same prediction made about BI tools may eventually be repeated with AI.
And history may once again produce a different outcome.
Smart Organizations Architect Around Excel Rather Than Fight It
Forward-looking enterprises are increasingly accepting an important reality.
Excel is not disappearing. Instead of attempting to eliminate it, they are designing architectures that incorporate it intelligently.
Modern ecosystems increasingly resemble the following:
ERP → Data Platform → Semantic Layer → BI Tools → Excel → Decision Making
In such environments, dashboards provide governed insights while spreadsheets provide analytical flexibility.
This hybrid model recognizes an important truth. Different tools serve different purposes. Trying to force every analytical activity into a dashboard environment often creates unnecessary friction.
Likewise, relying exclusively on spreadsheets introduces governance risks.
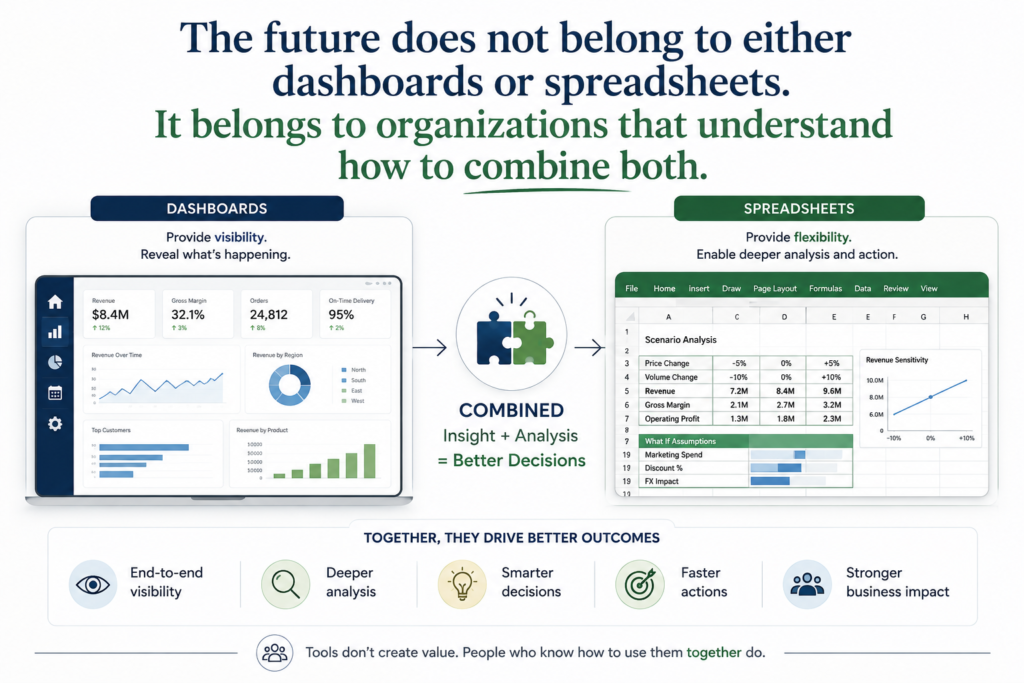
The future does not belong to either dashboards or spreadsheets. It belongs to organizations that understand how to combine both.
The BI Revolution Misunderstood Human Decision-Making
Perhaps the greatest misconception of the BI revolution was the assumption that decisions follow a straightforward sequence: Data. Dashboard. Decision.
Reality is considerably more complex.
Questions emerge. Assumptions change. Exceptions appear. Teams debate alternatives. Scenarios are evaluated. Recommendations evolve.
Decision-making is messy because organizations are made up of people, not algorithms. People think iteratively. They challenge assumptions. They explore possibilities. They revisit conclusions.
Excel survived because it aligns with that fundamentally human process.
Its resilience does not reflect technological superiority over BI platforms. Instead, it reflects a deeper understanding of how businesses operate.
The BI revolution undoubtedly transformed analytics. Dashboards improved visibility, democratized information, and accelerated insight generation.
But visibility alone does not produce decisions. Decision-making requires flexibility, experimentation, transparency, and trust.
Those qualities explain why spreadsheets remain deeply embedded within organizations.
And perhaps that is the most important lesson of all.
Excel survived the BI revolution not because businesses resisted change, but because business itself proved to be more human, more iterative, and far less structured than technology vendors expected.
Leave a Reply