



Diagnostic analytics moves beyond reporting outcomes to uncover drivers, relationships, root causes, and actionable insights for decisions.
Most organizations today have become reasonably good at answering one fundamental business question: What happened?
Revenue declined by 12%. Customer churn increased by 7%. Claims costs increased by 18%. Production yield dropped by 5%. A particular region missed its target.
The numbers are available. The dashboards are available. The reports are available.
Yet, when the leadership team asks the next question — “Why did this happen?” — the conversation often becomes considerably more difficult.
People start moving between different reports. Finance looks at one set of numbers, Sales provides another perspective, Operations brings in operational metrics, and someone eventually points towards market conditions or customer behaviour. The organization has plenty of data, but the explanation remains fragmented.
This is where diagnostic analytics becomes important.
Diagnostic analytics is not simply about creating more dashboards or adding more dimensions to an existing report. It is about systematically investigating the drivers, relationships, exceptions and underlying causes behind a business outcome.
The difference may appear subtle, but it represents an important shift in analytical maturity.
Descriptive analytics tells us what happened. Diagnostic analytics attempts to explain why it happened.
And that distinction becomes increasingly important as organizations move towards more sophisticated forms of decision-making.
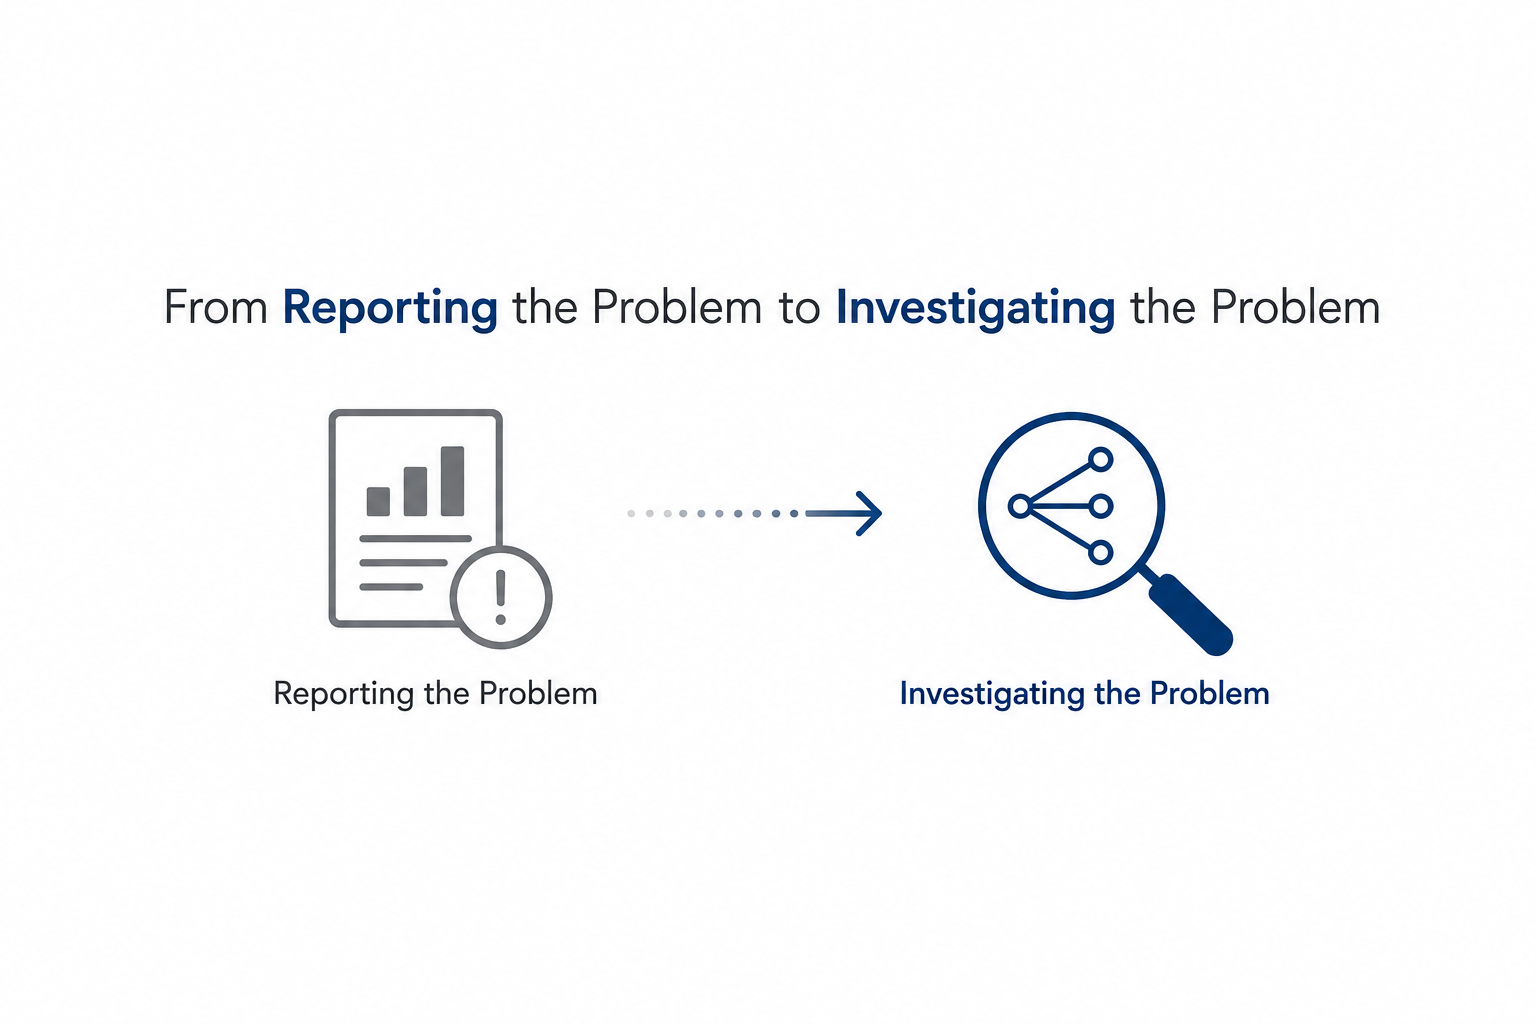
From Reporting the Problem to Investigating the Problem
Consider a simple example.
A company discovers that its quarterly revenue has declined by 12%.
A descriptive dashboard may immediately provide several useful observations. Revenue declined compared with the previous quarter. The North region contributed significantly to the decline. Two product categories experienced lower sales, and a particular customer segment purchased less than expected.
This is useful information.
But none of these observations necessarily answers the management question:
- Why did revenue decline?
- Was it because customers reduced demand?
- Was there a problem with product availability?
- Did competitors become more aggressive?
- Did sales representatives reduce their coverage?
- Did pricing change?
- Did discounts increase?
- Did certain large customers move their purchases to another supplier?
- Or was the decline actually caused by several factors interacting with each other?
This is where diagnostic analytics changes the nature of the analytical exercise.
Instead of treating the dashboard as the final destination, we treat the business outcome as the starting point of an investigation.
Five Layers of Diagnostic Analytics
A practical way of thinking about diagnostic analytics is to view it as a progression through five layers.
1. Identify the Variance
The first step is to identify what has changed materially from expectation or historical behaviour.
The variance could be between actual performance and budget, current performance and the previous period, or actual performance and an established benchmark.
For example:
- Revenue ↓ 12%
- Customer churn ↑ 7%
- Claims cost ↑ 18%
- Production yield ↓ 5%
- DSO ↑ 15 days
The objective at this stage is not to explain the problem immediately. It is to establish the magnitude, direction and significance of the deviation.
A useful diagnostic process therefore begins by asking:
Where is the variance coming from, and how material is it?
This sounds straightforward, but it is important because not every movement requires investigation. Some variations are normal business fluctuations. Others represent a meaningful departure from expected behaviour.
Diagnostic analytics needs to distinguish between the two.
2. Slice the Problem
Once the variance has been identified, the next question is:
Where is it happening?
This is where dimensional analysis becomes important.
Revenue, for example, can be broken down across:
Geography → Product → Customer → Channel → Salesperson → Segment → Time
The objective is to progressively localize the problem.
Instead of saying:
Revenue declined by 12%.
we may discover:
Revenue declined by 12%, with approximately 70% of the decline concentrated in the North region and two product categories.
That is a much more useful starting point for investigation.
The same principle applies across industries.
For a manufacturing organization, the problem could be segmented by plant, production line, product, shift, machine or supplier.
For a bank, it could be segmented by customer segment, geography, product, channel or branch.
For a pharmaceutical organization, the analysis might move across brand, therapy, geography, customer type, prescriber segment or sales territory.
The important point is that diagnostic analytics is not about slicing data randomly.
The dimensions should be selected based on a business hypothesis about where the underlying problem could reside.
3. Compare and Benchmark
Finding an abnormal segment is useful, but the next step is to understand what makes it abnormal.
This requires comparison.
A region may have declined by 15%, but is that actually unusual? Perhaps the entire organization declined by 14%.
A product may have experienced a 10% decline, but another product with a similar customer base may have grown by 8%.
A branch may have a higher cost-to-income ratio, but perhaps it also serves a fundamentally different customer mix.
This is why diagnostic analytics needs appropriate reference points.
Some common comparisons include:
| Comparison | Question it helps answer |
|---|---|
| Actual vs Budget | Why did we miss the plan? |
| Current vs Previous Period | What changed? |
| Product A vs Product B | Why is one performing differently? |
| Region A vs Region B | What is different operationally? |
| Customer Cohorts | Which customers are behaving differently? |
| Benchmark vs Organization | Where are we underperforming? |
The comparison itself does not provide the answer.
It helps identify where the investigation should go next.
That distinction is important.
Diagnostic analytics is essentially an iterative process of narrowing down the space of possible explanations.
4. Identify the Drivers
Once the abnormality has been localized and compared, we can begin investigating the drivers behind the outcome.
Consider a profitability problem.
Suppose:
Profit declined by 15%.
Further analysis shows:
- Revenue declined by 5%
- Gross margin declined by 8%
- Logistics costs increased by 12%
- Discounting increased by 6%
The analysis can then go one level deeper.
Why did gross margin decline?
Perhaps the organization experienced:
- Unfavourable product mix
- Higher raw material costs
- Increased discounting
- Lower manufacturing yield
Each of these becomes another branch in the diagnostic investigation.
This is where analytical techniques such as contribution analysis, variance decomposition, Pareto analysis, regression, correlation analysis, cohort analysis and anomaly detection can become valuable.
However, the objective should not be to demonstrate that sophisticated analytical techniques were used.
The objective is to improve the quality of the explanation.
A sophisticated model that does not help a business leader understand the problem is often less valuable than a simple analysis that clearly identifies the dominant driver.
5. Connect the Drivers Across Functions
This is perhaps the most important layer of diagnostic analytics.
Organizations often perform analysis within functional boundaries.
Finance analyses financial performance. Sales analyses sales performance. Operations analyses production and supply. Procurement analyses suppliers. Customer teams analyse customer behaviour.
The problem is that business outcomes rarely respect these organizational boundaries.
Consider a decline in sales.
The Sales dashboard may show that certain customers reduced their orders.
That is an observation.
When connected with other data, however, the organization may discover that those customers experienced lower product availability.
Operations data may then show that inventory levels declined.
Supply chain data may show that replenishment was delayed.
Procurement data may reveal that supplier lead times increased after a supplier transition.
Suddenly, the explanation is no longer:
“Customers reduced their orders.”
The organization now has a much richer diagnostic chain:
Customer orders declined → Product availability declined → Inventory reduced → Replenishment slowed → Supplier lead time increased → Supply decision changed
This is a fundamentally different analytical capability.
The organization is no longer looking at isolated insights.
It is building a connected explanation of the business outcome.
And this is where diagnostic analytics starts becoming particularly relevant to Decision Intelligence.
Correlation Is Not the Same as Cause
There is an important analytical discipline that should not be overlooked.
Diagnostic analytics frequently identifies relationships and potential drivers, but identifying a relationship does not automatically establish causality.
For example, suppose customer churn increases at the same time that customer service response time increases.
There may be a relationship between the two.
But that does not necessarily prove that slower response times caused the increase in churn.
There may be other variables involved, including customer segment, product quality, pricing, competitor activity or changes in customer acquisition.
Therefore, diagnostic analytics should distinguish between:
Observed relationship
Potential driver
Strong evidence
and
Established causal relationship
This distinction becomes particularly important when analytical findings are used to make significant business decisions.
The purpose of diagnostic analytics is not to manufacture certainty.
It is to reduce uncertainty and direct the organization towards the most plausible explanations and the right investigation.
Diagnostic Analytics Should Not Stop at “Why”
There is another common problem with diagnostic analytics.
Organizations sometimes treat the explanation itself as the end product.
For example:
“Revenue declined because the North region underperformed.”
But that is not necessarily actionable.
A stronger diagnostic output would explain:
What happened → Where it happened → What changed → What drove the change → What is likely contributing to the problem → What should be investigated or acted upon
That final transition is critical.
Once the organization understands the likely drivers, it should be able to move towards the next question:
“So, what should we do about it?”
This is where diagnostic analytics begins to connect with prescriptive analytics.
The Real Maturity Test
The maturity of an analytics organization should therefore not be measured simply by the number of dashboards it has created, the sophistication of its models, or the number of KPIs it can monitor.
A more meaningful question is:
When a business outcome changes unexpectedly, how quickly and reliably can the organization explain why?
Can it identify the variance?
Can it localize the problem?
Can it compare the abnormal behaviour against an appropriate benchmark?
Can it identify the dominant drivers?
Can it connect those drivers across functions?
And most importantly, can it move from explanation to action?
Organizations that can answer these questions consistently are moving beyond reporting.
They are building an analytical capability that is much closer to decision support.
Diagnostic analytics, therefore, should not be viewed simply as the layer between descriptive and predictive analytics.
It is the investigative engine that connects business outcomes to their underlying drivers.
And when that investigative capability is connected with prediction, prescription and execution, analytics starts becoming something much more valuable than a mechanism for reporting what happened.
It becomes part of the organization’s decision-making system.
Leave a Reply